
Context
- The exodus of migrant workers from the cities following the announcement of the 21-day lockdown threw the spotlight on the vast number of Indians who live outside their home states.
Facts and Figures:
- The total number of internal migrants in India, as per the 2011 census, is 45.36 crore or 37% of the country’s population. This includes inter-state migrants as well as migrants within each state, while the recent exodus is largely due to the movement of inter-state migrants.
- The annual net flows amount to about 1 per cent of the working age population. As per Census 2011, the size of the workforce was 48.2 crore people. This figure is estimated to have exceeded 50 crore in 2016 — the Economic Survey pegged the size of the migrant workforce at roughly 20 per cent or over 10 crore in 2016.
- While there is no official data for the inter-state migrants in the country, estimates for 2020 have been made by Professor Amitabh Kundu of Research and information System for Developing countries. His estimates, which are based on the 2011 Census, NSSO surveys and economic survey, show that there are a total of about 65 million inter-state migrants, and 33 per cent of these migrants are workers. By conservative estimates, 30 per cent of them are casual workers and another 30 per cent work on regular basis but in the informal sector.
- If you add street vendors, another vulnerable community which is not captured by the worker data, that would mean that there are 12 to 18 million people who are residing in states other than that of their origin and have been placed at a risk of losing their income.
- A study by the Centre for the Study of Developing Societies (CSDS) and Azim Premji University in 2019 estimates that 29% of the population in India’s big cities is of daily wagers. This is the number of people which would be logically wanting to move back to their states.
- Professor Kundu’s estimates show that Uttar Pradesh and Bihar account for the origin of 25 per cent and 14 per cent of the total inter-state migrants, followed by Rajasthan and Madhya Pradesh, at 6 per cent and 5 per cent.
- This means that around 4-6 million people would be wanting to return to Uttar Pradesh, and 1.8-2.8 million to Bihar. Another 700,000 to 1 million would be wanting to return to Rajasthan and 600,000-900,000 to Madhya Pradesh.
What they earn, experience
- As per the ‘Politics and Society Between Elections Survey’ from 2017-19 conducted by the CSDS, the monthly household income of 22% daily and weekly wagers is up to Rs 2,000; of 32%, between Rs 2,000 and 5,000; of 25%, between 5,000 and 10,000; of 13%, between Rs 10,000 and 20,000; and of 8%, more than Rs 20,000.
- A CSDS survey during the recent Delhi Assembly elections also found that 20% of respondents reported their monthly household income to be less than Rs 10,000.
- Among migrants from Bihar and UP, this was even higher at 33% and 27%, respectively.
- Professor Tariq Thachil of Vanderbilt University has worked on the circular migrant population in India. His research found that migrant populations neither wholly retain nor completely discard their village-based ethnic ties, which is witnessed by their willingness to walk hundreds of kilometres once their source of livelihood is taken away.
- His research, based on a large survey of 2,400 seasonal migrants sampled from 51 marketplaces across Lucknow, underscored the pre-eminence of the police in shaping the urban experiences of migrants, relative to their rural lives.
- Remarkably, 33% of respondents in the survey personally experienced violent police action within their past year in the city, while fewer than 5% had ever done so in their home villages.
Mostly in cities
- That the inter-state migrant crisis after the lockdown was felt more by cities like Delhi, Mumbai and Surat is borne by the 2011 Census data. Professor Chinmay Tumbe of IIM Ahmedabad has highlighted that Delhi has a migration rate of 43%, of whom 88% are from other states and 63% are from rural areas. Mumbai has a migration rate of 55%, with 46% migrants from other states and 52% from rural areas. Surat, which witnessed police action on a group of migrants on Sunday, has a migration rate of 65%, with 50% migrants from other states and 76% from rural areas.
- Professor Tumbe has also noted that the information about districts in originating states, from where these workers come and would have returned, is not current and is based on estimates from the 1990s. His paper, ‘Urbanisation, Demographic Transition and the Growth of Cities in India, 1870-2020’ has the data for source regions of migrants in major cities in 1990s, as the 2011 census data on it has not been released so far.
- This data is important to identify the districts which should be on high alert for potential virus spread as these workers return to their homes. For example, Ganjam in coastal Odisha has a lot of people working in Gujarat and Professor Tumbe has noted that there have been instances recorded in the past which includes AIDS transmission via Surat. As Professor Siddharth Chandra’s work shows, the 1918 influenza virus was carried to rural India in Uttar Pradesh and Bihar by soldiers who fought in Europe in the First World War. They returned by ships to Bombay and Madras and then carried the virus to their villages, causing a disaster which saw 18 million deaths in India.
District to district
- District-wise migration data in the Economic Survey for 2016-17 show that the highest influx of migrants within the country is seen in city-districts such as Gurugram, Delhi and Mumbai along with Gautam Buddh Nagar (Uttar Pradesh); Indore, Bhopal (Madhya Pradesh); Bangalore (Karnataka); Thiruvallur, Chennai, Kancheepuram, Erode, Coimbatore (Tamil Nadu).
- The districts showing the highest outward movement of migrant workers include Muzaffarnagar, Bijnor, Moradabad, Rampur, Kaushambi, Faizabad and 33 other districts in Uttar Pradesh, Uttarkashi, Chamoli, Rudra Prayag, Tehri Garhwal, Pauri Garhwal, Pithoragarh, Bageshwar, Almora, Champawat in Uttarakhand; Churu, Jhunjhunu, Pali in Rajasthan; Darbhanga, Gopalganj, Siwan, Saran, Sheikhpura, Bhojpur, Buxar, Jehanabad in Bihar; Dhanbad, Lohardaga, Gumla in Jharkhand; and Ratnagiri, Sindhudurg in Maharashtra.
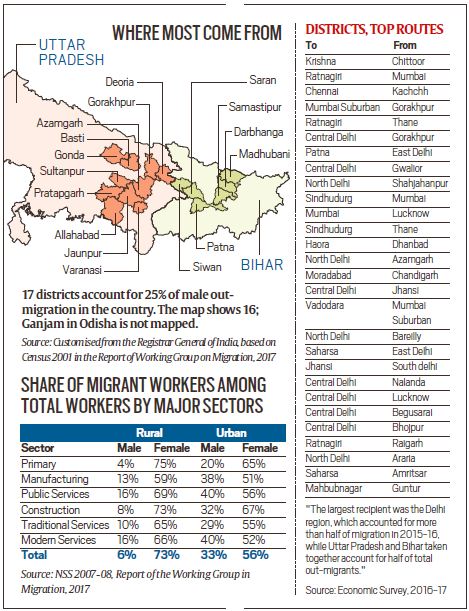
- As per the Report of the Working Group on Migration, 2017 under the Ministry of Housing and Urban Poverty Alleviation, 17 districts account for the top 25% of India’s total male out-migration. Then of these districts are in UP, six in Bihar and one in Odisha (see map above).
Economic Survey
- “Relatively less developed states such as Bihar and Uttar Pradesh have high net out-migration. Relatively more developed states take positive CMM values reflecting net immigration: Goa, Delhi, Maharashtra, Gujarat, Tamil Nadu, Kerala and Karnataka. The largest recipient was the Delhi region, which accounted for more than half of migration in 2015-16, while Uttar Pradesh and Bihar taken together account for half of total out-migrants. Maharashtra, Goa and Tamil Nadu had major net in-migration, while Jharkhand and Madhya Pradesh had major net out-migration,” the Economic Survey had stated.
The Report of the Working Group on Migration
- shows that the share of migrant workers is the highest in construction sector for females (67 per cent in urban areas, 73 per cent in rural areas), while highest number of male migrant workers are employed in public services (transport, postal, public administration services) and modern services (financial intermediation, real estate, renting, education, health) at 16 per cent each and 40 per cent each in rural and urban areas, respectively
Source:IE